L7A
Chapter 1: The Problem No One Solved
“This is a different school — one not aimed at mimicking the past, but at surviving the future.”
For over half a century, some of the brightest minds in science, finance, and technology have tried—and failed—to solve one of the most alluring challenges in modern data science: reliably forecasting short-term movements in the S&P 500.
At first glance, it seems like the perfect machine learning problem. Every day, the market produces new data. Every day, algorithms can train, test, and iterate. The potential payoff is enormous—and the data is public. The prize isn’t academic. It’s real, liquid, and waiting.
And yet, across decades of research, institutional investment, and AI breakthroughs, most attempts have ended the same way: with models that either overfit the past or fall apart in the future. Finance textbooks call the market “efficient,” implying that such prediction is impossible. But maybe that verdict wasn’t based on truth—only on failure.
This book tells the story of L7A: a forecasting system that breaks that pattern. It did not emerge from Wall Street. It was not trained on millions of GPUs or fine-tuned with market labels from a secret dataset. It was built quietly, methodically, and with a different philosophy—one shaped not by academic fashions but by evolutionary principles, probabilistic reasoning, and decades of firsthand experience in AI.
At its heart lies a simple belief: that structure exists. Not in the form of trends, regimes, or clever feature engineering, but in the behavior of the market itself—buried in noise, yet persistent. The goal is not to chase the past but to survive the future. That requires generalization, not mimicry.
The chapters that follow will explain how L7A was built, why it works, and what its success reveals—not just about finance, but about intelligence itself.
Chapter 2: Noise, Illusion, and the Myth of Randomness
For decades, the academic world has clung to a powerful idea: that markets are efficient. Prices, it is claimed, reflect all available information. Any pattern visible in hindsight is an illusion—an artifact of randomness, not structure.
To a first approximation, this claim is true. The S&P 500 is not predictable in the way a sine wave is. Its fluctuations are driven by thousands of interacting forces—earnings, sentiment, macroeconomics, and geopolitics—all filtered through layers of speculation, reflexivity, and noise. Most of what we observe is noise.
But that’s not the same as saying all of it is.
The real challenge lies not in fitting curves to the past, but in identifying invariant behavioral structure beneath the turbulence. And this is where most systems fail. Neural networks overfit. Statistical models regress toward the mean. Feature engineering chases ghosts. Even deep reinforcement learners, when pointed at market data, often discover only the tradeoff between transaction costs and randomness.
Why? Because the signal is weak. It doesn’t shout—it whispers. And to hear it, one must strip away the illusion that all predictability is temporary, that nothing persists, and that generalization is impossible.
This is not a problem of computation. It’s a problem of philosophy. Most approaches treat the market like a pattern to be recognized, rather than a behavior to be understood.
L7A begins with a different assumption: that human behavior—especially under risk—is not random. It is bounded. It is patterned. It repeats—not in form, but in function. And if we can capture that function, even partially, we gain an edge.
In the next chapter, we’ll begin to explore how L7A does exactly that—by using trace-based structures, evolved map surfaces, and a classification architecture built not to mimic past outcomes, but to survive in an unpredictable world.
Chapter 3: A Different Species of Intelligence
When most people hear “forecasting system,” they imagine a conventional machine learning pipeline. Historical data goes in, features are extracted, and a model—perhaps a neural network—is trained to minimize error on past outcomes. The result: a black box with knobs, gradients, and hopefully, predictive power.
L7A is not that. It’s not a regression. It’s not a trend follower. It’s not even a standard neural network—though, in structure, it bears resemblance. It is something else entirely: a map-based, genetically evolved inference system designed not to fit data, but to generalize from it.
That difference is not cosmetic. It is foundational.
Where most models train their weights via backpropagation—tweaking internal connections based on how wrong they were—L7A does the opposite. Its weights are never adjusted to match past errors. Instead, they are accumulated, tested, and selected through an evolutionary process that explicitly penalizes failure to generalize.
This process doesn’t just ask: How well did you do yesterday? It asks: How consistently do you survive tomorrow?
At the core of L7A is a visual metaphor: a map. Every input trace—a sequence of behavior from an individual stock—is projected onto this map, which stores a histogram of directional outcomes. These maps don’t fit curves. They build terrain. And in that terrain, ridges and valleys emerge—zones where the same input structure repeatedly leads to a directional move.
Over time, thousands of these traces accumulate. And like a geologist reading erosion patterns in rock, L7A begins to see the shape of underlying structure. Not trends. Not momentum. But something deeper: time-invariant behavior.
This approach has consequences. It means the system does not require retraining. It does not rely on curve-fitting. It does not assume patterns exist—it proves their usefulness by walking forward through time, and surviving.
The result is a forecasting system that doesn’t just echo the past. It operates on a different principle entirely. It’s not trying to guess the market’s next move based on similarity. It’s trying to infer the future from a foundation of structural stability—learned not by mimicry, but by evolution.
In the next chapter, we’ll open up that structure. We’ll look inside the map surface, the classification layer, and the evolutionary engine that powers it all.
Chapter 4: Anatomy of a Forecast
To understand how L7A generates a forecast, we have to follow the process from the ground up—from the raw data to the final directional signal. Unlike most machine learning systems, this journey doesn’t pass through feature engineering, neural activations, or stochastic optimization. It passes through something more primitive—and more powerful: map surfaces shaped by behavioral trace patterns.
Let’s begin at the input.
Each day, L7A ingests the recent price history of every equity in the S&P 500. These price histories—called traces—are not raw percent changes or normalized indicators. They are structured time series: compressed, shaped, and scaled according to evolutionary parameters optimized for generalization. Think of them as behavioral fingerprints—compact signatures of recent action.
Each trace is projected onto a map surface: a fixed-size, two-dimensional grid where each cell stores a histogram of past directional outcomes. If a particular trace shape has repeatedly preceded a market rise, the corresponding cell becomes skewed toward positive classifications. If it leads to noise or reversal, the histogram reflects that ambiguity.
But here’s the key: these maps are not trained via error correction. They are accumulated over thousands of walk-forward days, and their structure is refined through evolution, not gradient descent. Each map configuration competes in a population, tested solely on out-of-sample data. Only those that generalize—by accurately forecasting tomorrow based on today’s map activations—survive and mutate forward.
This is where the magic begins. When hundreds of individual equity traces hit their respective maps, they cast directional votes—binary, +1 or -1—based on their cell’s histogram. These votes are aggregated, filtered, and weighed into a composite forecast for the entire market.
The result is a single directional signal: long, short, or zero.
And that signal does not come from any one model. It emerges from an ensemble of maps—each evolved independently, each seeing the world through a different lens. Some are narrow and sharp, others wide and smooth. But together, they form a surface of collective inference. Like organs in a nervous system, they act in unison to predict the next step.
In the chapters ahead, we’ll explore each component in detail: the encoding of traces, the structure of maps, the Bayesian update layer, and the evolutionary cycle that drives continual refinement. But for now, one thing is clear:
L7A doesn’t guess the future. It accumulates structure, filters noise, and evolves the ability to see patterns that persist—no matter how turbulent the world becomes.
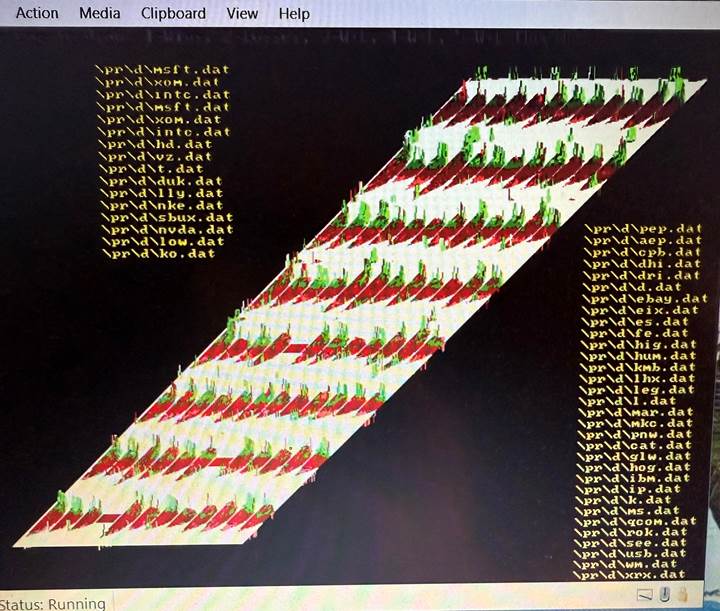
Below is an image of one of the map surfaces showing the 96 equity “traces” and their related histograms- encoding the probable outcome. Many of these surfaces are used to form the final output. They are near cousins to neural net “layers”, but are determined in a formal statistical method as compared to backpropagation of errors.
Chapter 5: The Map is the Model
If L7A has a soul, it lives in the map surface.
Each map is a fixed-size grid, typically two-dimensional, whose cells accumulate evidence over time. That evidence comes in the form of traces—behavioral patterns from recent equity movement—projected into the grid by encoding functions shaped through evolution.
Each trace hits a location on the map, and the cell it strikes is updated. But what’s stored there isn’t a weight in the usual sense. It’s a histogram: a count of how many times that input pattern led to a market rise versus a market fall the next day.
These histograms are the heart of L7A’s inference engine. They do not fit curves. They do not chase trends. They simply count.
This may sound primitive, but it is anything but. Because what emerges from this aggregation is a remarkably stable surface—one that resists noise and highlights structure. Certain regions light up with directional clarity. Others remain ambiguous. Over time, the map becomes a visual topography of behavioral consequence.
To convert those histograms into actionable signals, L7A applies a classification layer. In the standard version, this is a binomial probability estimate: the fraction of up versus down outcomes, possibly adjusted by Bayesian smoothing to account for sample size.
But L7A is not married to Bayes. In fact, other internal systems—like DX48—use a different method entirely: confidence intervals derived from sample size and directional skew. In this variant, a cell’s score is not interpreted as a probability, but as a confidence-weighted indicator: how sure we can be that this cell means “up,” given how many times it’s been hit and how extreme its bias.
The point is not the
statistical method. The point is the
structure: inference from count-based surfaces, shaped by behavior, and
subjected to evolutionary filtering for generalization.
This is what makes the map not just a memory, but a model. It stores what worked—not because it was trained to—but because it survived. And because maps are visual, they can be interpreted. You can see the ridges, the valleys, the convergence zones. You can tell whether a prediction comes from strength or from noise.
And that interpretability is not a side benefit—it’s part of the design. Because if you can see how your model thinks, you can test whether it’s sane. That’s a luxury most neural networks don’t afford.
In Chapter 6, we’ll zoom out again and show how many such maps form an ensemble—how the votes are tallied, filtered, and collapsed into a single directional signal. But before we leave this chapter, remember this:
In L7A, the map is the model. Everything else is just scaffolding.
Chapter 6: The Wisdom of the Ensemble
One map can learn. A hundred maps can generalize.
L7A doesn’t rely on a single master surface to forecast the market. Instead, it deploys an ensemble: a population of independently evolved maps, each with its own structure, encoding scale, and behavioral fingerprint. These maps see the same world—but from different vantage points.
Why? Because no single projection captures the whole truth. One map might focus narrowly on recent volatility. Another might stretch its trace encoding to absorb longer memory. One may evolve to reward sharp reversals; another may track slow continuation. Each map encodes a hypothesis about what matters—and only those whose votes consistently help the ensemble survive are retained.
This diversity is no accident. It is the result of evolutionary pressure, not architectural design. L7A doesn’t hand-pick maps or tune them for orthogonality. It simply lets them compete. Those that forecast well—on future data, not past—survive and mutate. Over time, the population converges on a collection of useful perspectives, filtered by walk-forward success.
Each day, as new traces are fed into the system, they activate locations across every map. These locations vote—binary signals, +1 or -1—based on the histogram in that cell. Some votes are strong; some are weak. Some maps abstain entirely if the trace lands in an ambiguous zone.
The votes are aggregated, filtered, and tallied. The result is a directional ensemble signal: long, short, or zero. This final decision is not driven by any one model—it emerges from the overlap and confidence of many.
And here lies one of L7A’s most subtle strengths: it suppresses noise through redundancy. Where one map may be fooled by noise, ten are not. Where one sees a phantom signal, the others remain neutral. Over time, this averaging effect yields not just accuracy—but stability.
This is not ensembling in the casual sense. It is not bagging, boosting, or stacking in the machine learning tradition. It is survival-based aggregation: models earn their place through walk-forward merit, and their votes are counted only when they reflect demonstrated reliability.
The result is a system that adapts without adapting. The maps don’t change daily. They are stable. What changes is the pattern of trace activations—and how those activations land across a structurally diverse surface.
This is why L7A rarely needs retraining. Its ensemble is not trained to fit. It is evolved to generalize. The signal comes not from optimization, but from structural redundancy and directional convergence.
In Chapter 7, we’ll turn our attention to how this signal is interpreted in live deployment—how forecasts are handled, how abstention works, and why L7A prefers to remain silent rather than speak without confidence.
Chapter 7: Discipline at the Decision Boundary
“What matters is whether it
works.”
That’s not just a conclusion—it’s the principle that shaped the system.
In forecasting, there is a temptation as old as modeling itself: to always produce an answer. Most systems do. Whether the data is strong, weak, ambiguous, or noisy, the model responds with a prediction—often because it was designed to.
L7A does not share that compulsion.
When the evidence is unclear, when the map activations scatter, or when the ensemble lacks consensus, L7A does something almost unheard of in machine learning systems: it abstains.
This is not a bug. It’s not a fallback. It’s a principle.
The architecture of L7A enforces this discipline at multiple levels. First, individual maps may decline to vote when their activation lands in a low-confidence cell. Then, across the ensemble, directional votes may cancel—yielding no statistical edge in either direction. Finally, the decision layer evaluates the signal’s strength. If the conviction is weak, the forecast is zero.
This built-in reluctance to act without clarity is what gives L7A its stability. It is not reactive. It does not chase the market. It only speaks when it has something to say—when the behavioral structure aligns, the ensemble agrees, and the map history supports the call.
And that restraint has a measurable effect. Over thousands of walk-forward days, L7A produces a nonzero forecast only when the statistical edge is present—yielding a high true positive rate, a low false positive rate, and a return stream that reflects discipline, not frequency.
This stands in sharp contrast to neural networks trained on daily classification tasks, where outputs are always forced—even when confidence is low. In finance, such compulsion is dangerous. Acting without edge is indistinguishable from gambling.
But L7A is not a gambler. It is an inferential system built for adversarial conditions. And in adversarial domains, silence is signal. It tells us: the world has changed, the structure is unclear, or the confidence is insufficient. And that, too, is information.
This discipline at the decision boundary is not merely risk control. It is a philosophical stance. L7A does not promise clairvoyance. It promises generalization—and only when it has earned the right to speak.
In the next chapter, we’ll step back to examine what makes this performance so unusual. We’ll quantify the walk-forward results, the error rates, and the statistical rigor behind L7A’s claims—because in the end, what matters isn’t how elegant the system is.
What matters is whether it works.
Chapter 8: Performance Without Excuses
It’s easy to build a model that performs well in backtests. It’s much harder to build one that survives in the future.
Every algorithm looks smart in hindsight. Curve-fitting is cheap. Feature engineering can manufacture signals. Overfitting, once considered a bug, is now a standard tool in the arsenal of financial machine learning.
But L7A was never designed to win backtests. It was designed to survive walk-forward reality—and to do so without excuses, without retraining, and without the crutches of regime detection, momentum, or trend following.
The benchmark for L7A is brutal: does it forecast the S&P 500 tomorrow, using only information available today—with no peeking, no adjustments, and no second chances?
The answer is yes. Over thousands of consecutive, walk-forward days, L7A outputs a directional forecast—long, short, or abstain—and tracks the market’s next-day movement. No labels are reused. No data is revised. And the results are staggering:
- Win/loss points ratio (OOS):
72%
- Sharpe Ratio: 3.0
- Sortino Ratio: 4.51
- Total Net Return (1-day hold strategy): 25,294 GSPC points
- Maximum Drawdown: -247 points
These metrics are not the product of tuning. They are the emergent properties of a system that evolves to generalize. No hand-crafted filters. No optimization against the test set. Just raw walk-forward truth.
What’s more, L7A achieves these results without ever requiring retraining. The same ensemble of maps performs across the full span of historical data. That’s not just convenience. It’s proof of time-invariant behavioral structure—a discovery that cuts to the core of what makes markets not efficient, but human.
Even more remarkably, L7A achieves this while producing forecasts only when confident. It doesn’t trade every day. It trades selectively. And when it does, it wins.
This isn’t just statistical success. It’s structural success. L7A is not rewarded for adapting to noise. It is rewarded for consistency under pressure—exactly the environment where most machine learning systems collapse.
In the next chapter, we’ll look beyond performance metrics. We’ll explore what this system reveals about markets, intelligence, and the kinds of architectures that can truly generalize in adversarial environments.
But first, remember this:
L7A didn’t beat the market by chance.
It did it by refusing to guess—and learning to infer instead.
Chapter 9: When Evolution Learns
Every serious AI researcher knows the history. The perceptron. The winter. Backpropagation. The rise of deep networks. The triumph of GPUs. The cascade of milestones: ImageNet, AlphaGo, GPT. We tell the story with pride—how we taught machines to see, speak, translate, and play.
But beneath that triumph lies a tacit assumption: that backpropagation—the slow, gradient-based tuning of weights from error—is the royal road to intelligence. We’ve built an empire on this idea. And for many domains, it works.
But what if we’ve mistaken a tool for a principle?
L7A tells a different story. It is, by any technical definition, a neural network. It has inputs, weights, a decision function, and outputs. But its weights are not learned by error correction. They are accumulated, tested, and selected—not to fit the past, but to survive the future.
This is not a semantic distinction. It is an architectural divergence.
Backpropagation assumes that intelligence is sculpted by mistakes—that if a model performs poorly, we must push its weights in the direction of less error. It is a reactive paradigm, pulling the system toward better behavior one nudge at a time.
But evolution doesn’t work that way. And neither does L7A.
In L7A, weights are formed through direct exposure to behavior. A trace lands. A count is updated. A histogram grows. Over time, the map forms—not through fitting, but through structural exposure. It is not tuned—it is weathered. And only those maps that generalize—that make accurate forecasts on unseen data—are retained and allowed to evolve forward.
This introduces something backpropagation cannot offer: pressure to generalize, embedded at every layer. Generalization is not measured after training—it is enforced during development. No gradient is ever followed. No training error is minimized. The only thing that matters is whether it works tomorrow.
And it does.
This should force us to re-examine some of our assumptions—not just in finance, but across AI. We have grown accustomed to overfitting and regularization. We accept that deep networks hallucinate, that they require large data, that they struggle with noise. But maybe that’s not a necessary tradeoff. Maybe it’s a symptom of the tools we’ve chosen.
Because in a domain where the data is noisy, sparse, adversarial, and constantly shifting—like short-term market movement—backpropagation collapses. It cannot maintain generalization. It adapts too much or too little. It either chases ghosts or misses structure.
L7A survives where those systems fail. And it does so because its architecture evolved under pressure to generalize. Every part of it—trace encoding, map shape, voting logic—was built to pass a single test: can you forecast without curve-fitting?
That question lies at the heart of not just finance, but intelligence.
In nature, intelligence evolved under pressure. Brains were not trained on datasets. They emerged from systems that survived uncertainty. And if we are serious about building general intelligence—the kind that can act in the world, adapt to novel conditions, and reason under noise—then we must begin to value not just performance, but robustness under evolution.
L7A is not general AI. But it points the way. It is a fully functional system, operating in real time, in a brutally hard domain, with no shortcuts—and it works. Not because it fits the past, but because it discovers structure that endures. It is not trained. It is selected.
In the chapters that follow, we will explore what this architecture might offer beyond finance. But let this chapter stand as the philosophical turning point:
Intelligence is not what mimics
best.
It is what survives.
Chapter 10: Beyond the Chart
L7A was born in finance. But its principles were not.
The system doesn’t know it’s forecasting a market index. It doesn’t understand earnings, interest rates, or geopolitics. What it sees is behavior—structured, repeatable, and embedded in time. What it responds to is consequence: what happened after a certain pattern appeared.
This detachment from domain-specific semantics is not a weakness. It’s a strength. It means the architecture is not bound to trading. It can be applied wherever inference under uncertainty is required—especially when the data is noisy, sparse, and adversarial.
And that opens a new frontier.
Imagine using L7A-like map surfaces in robotic navigation, where movement traces lead to terrain outcomes. Or in medical diagnostics, where patient histories form behavioral traces, and treatment responses become directional signals. Or in autonomous agents, where internal state trajectories yield outcome probabilities—and abstention, not guessing, is rewarded.
The possibilities stretch far beyond finance. Because what L7A demonstrates isn’t just a clever technique. It’s a new kind of inference engine: one that does not learn by mimicking, but by surviving. One that evolves structure instead of approximating it. One that resists noise instead of absorbing it.
This matters.
It matters because most of our current AI systems fail in the same predictable ways: overconfident in sparse data, brittle under distribution shift, blind to their own uncertainty. They hallucinate. They overfit. They extrapolate poorly. And we accept this as normal.
But L7A offers an alternative. Not a neural network replacement, but a complementary architecture—one that trades expressive power for robust generalization under pressure. It works not by finding the best fit, but by accumulating what survives.
This approach—evolution under generalization pressure—could be the missing ingredient in our pursuit of general intelligence. Not as a replacement for deep networks, but as a substrate for stability. A layer that filters, remembers, infers, and abstains.
And perhaps most importantly,
it provides a different lens on intelligence itself. One that says:
- Intelligence isn’t fast—it’s robust.
- Intelligence isn’t clever—it’s persistent.
- Intelligence doesn’t emerge from tuning.
It emerges from surviving.
L7A is not the final word. But it is a new sentence—one worth writing across more domains.
Chapter 11: Same Output, Different Futures
At first glance, neural networks seem like ideal inference
engines. They take an input, process it through layers of nonlinear
transformation, and output a result. Train them on enough examples, and they
learn to map the right input to the right output. Problem solved—on paper.
But that’s the problem.
For any given input-output mapping, there are countless internal weight
configurations that all produce the exact same result on the training data. And
yet, when faced with slightly altered inputs, these different configurations
can diverge wildly in behavior. This is a critical issue- the existence of
multiple weight configurations that produces similar training performance but
vastly different generalization behavior. This relates to something called the
“lottery ticket hypothesis” and mode connectivity in backprop neural networks.
The issue isn’t in the mapping—it’s in the internal representation.
This is the underappreciated failure
mode of backpropagation-based learning. It does not enforce structure. It
does not reward robustness. It only minimizes error on what it has already
seen. As long as the output matches the label, the internal logic is unchecked.
Modern neural networks attempt to patch this with regularization: dropout,
weight decay, pruning, and other tricks. But these methods are external
patches, not structural solutions. They may reduce overfitting, but they do not
guarantee internal smoothness or robustness. A network can still arrive at a
brittle internal configuration that simply happens to pass through
regularization’s loose filter.
The result? Two networks may perform identically in
training, but one has learned a smooth, general representation—while the other
has memorized the landscape with fragile precision. On novel inputs, one
remains sane. The other collapses.
In domains like image classification or text prediction, this brittleness can
often be masked by data volume or redundancy. But in noisy, low-data
environments—like short-term market forecasting—there is no such cover. The
illusion of generalization is quickly shattered.
L7A was designed specifically to survive
this regime. It does not rely on any single configuration of weights. It does
not learn by fitting. It evolves structure under pressure to generalize. Every
map surface must prove itself—not just by mapping past inputs to known
outcomes, but by forecasting future ones it has never seen.
This evolutionary filter is what gives L7A its edge. It cannot accidentally
learn a brittle structure and survive. Only robust, transferable behavior
patterns are selected forward. Every count, every trace, every cell in the map
earns its place through walk-forward validation.
This is the architectural gap between L7A and conventional
neural nets:
- Neural networks optimize for fit.
- L7A evolves for function.
- Neural nets mimic.
- L7A generalizes.
- Regularization attempts to dampen noise.
- L7A demands structure that survives it.
This distinction—subtle but profound—is what separates a system that performs
on paper from one that survives the future.
And perhaps most importantly: L7A’s internal structure is interpretable. You can visualize its maps. You can trace how a signal emerged. You can see the ridges and valleys of confidence. With neural networks, that window is shut. The logic is buried in millions of opaque weights.
Chapter 12: The Architecture of What Endures
Every system carries a worldview.
Deep networks suggest that intelligence is a function of scale. The more data, the deeper the stack, the closer we get. Just keep tuning. Keep pretraining. Keep layering. The path to understanding lies in more.
L7A is different. It doesn’t grow deeper. It grows clearer.
Its architecture suggests that intelligence is not about size—it’s about structure. Not in how expressive a network is, but in whether its outputs can survive unchanged when the world shifts. It says the future belongs not to the cleverest algorithm, but to the one that endures.
This isn’t a romantic ideal. It’s a testable one.
Across thousands of walk-forward days in one of the most adversarial data domains on Earth—the S&P 500—L7A doesn’t just persist. It thrives. It forecasts not by spotting trends or adapting to regimes, but by capturing stable structures in human behavior. And it does this with no retraining, no labels beyond T+1, and no hand-holding.
That’s not a finance story. That’s an intelligence story.
Because in every field where AI falters—autonomous driving, language hallucination, brittle chatbots, fragile agents—the core problem is the same: lack of generalization. Systems fail not because they weren’t large enough, but because they were trained to fit, not to endure.
L7A offers an existence proof: that it’s possible to build systems that are forced to generalize by their very design. That by applying evolutionary pressure—not just backpropagation—we can shape architectures whose structure reflects not what the past rewarded, but what the future permits.
This has implications far beyond markets. It asks the field to reconsider what it values: fluency or resilience, adaptation or preservation, cleverness or clarity. It invites a generation of builders to try something bolder:
To stop
chasing the past.
And start evolving for the future.
Because in the end, the architectures that endure will not be the ones that mimic best. They’ll be the ones that make the fewest excuses, ask the clearest questions, and hold up under pressure.
L7A is one such architecture. And its legacy may be this:
That generalization is not an
outcome.
It is a prerequisite.
Chapter 13: From Idea to Architecture to Edge
What begins as an idea must eventually touch the world. L7A was never meant to remain a thought experiment. It was built to run. To trade. To decide.
And it does.
Every day, across thousands of trading sessions, it takes in raw behavior from hundreds of stocks. It traces those behaviors against a fixed lattice of memory. It updates nothing. It adapts to nothing. It simply compares.
Each trace lands on a surface shaped not by fitting, but by evolution—histograms of directional behavior that have survived real-world validation, walk-forward pressure, and statistical challenge. The result is a clean, binary signal: long, short, or abstain. No momentum models, no moving averages, no optimization of trade exits. Just structure, distilled.
And it works remarkably well..
It works without hype. It works without retraining. It works across years of market regimes, shocks, melt-ups, crashes, and fads. Because what it models is not volatility or news, but behavior itself: the latent inertia, fear, and elasticity of the human condition—encoded in price.
This is the real legacy of the L7A system: it transforms the vague aspiration of generalization into a working engine of inference. Not by claiming AI mastery, but by forcing the model to earn its forecast—day after day—under the harsh light of walk-forward exposure.
It is here that the design meets its proof.
That
structure, when evolved rather than fit, can survive.
That simplicity, when validated, can outperform complexity.
That generalization, when enforced, can become a source of edge.
What follows in the chapters ahead is not theory. It is execution. You will see how L7A was built, tested, deployed, and challenged. And in that process, you’ll see something more:
A blueprint for inference under pressure.
A philosophy in code.
An idea—made real.
Chapter 14: Building the Machine
No matter how elegant an idea, it means nothing until it runs. Inference—real inference—requires instantiation. Structure must take on form. A model must make decisions. Not once, but thousands of times. Under pressure. Without excuses.
This is where L7A comes alive.
At its heart, L7A is a machine—not metaphorically, but literally. A software engine written in C, tuned for speed, determinism, and transparency. There is no stochasticity in its core. No random dropout layers. No backpropagation. It is built to simulate, forecast, and walk forward on every single day of historical market data—over 5,000 sessions—without ever seeing the future.
The architecture is modular. It starts with inputs: not price percent changes, but traces—multiday patterns compressed into gridable forms. These traces are aligned in time (with T₀ as the decision point) and scaled using a surface profile that determines how much weight each day in the trace contributes to classification.
Then comes the map.
Each trace is fed into a lattice: a 2D histogram surface where contributions accumulate. These surfaces are directional—split by whether the forecast outcome on the following day was up (+1) or down (-1). With thousands of such surfaces evolved across cross-validation folds and equity subsets, the system constructs a kind of distributed memory: a terrain of behavioral likelihoods.
But the magic is not in how this memory is constructed. It is in how it is tested. Every configuration is evaluated not on its training fit, but on its walk-forward generalization. Maps are evolved under pressure—using genetic algorithms that reward consistency, clarity, and predictive edge, not raw accuracy.
And then the machine speaks.
For each new day, L7A scans its ensemble. It aggregates surface contributions. It computes directional confidence. And it outputs a simple, clean signal: +1 (go long), -1 (go short), or 0 (abstain). There is no smoothing. No post-hoc adjustment. No retry.
This is the backbone of L7A: a fully deterministic, fully auditable inference engine that doesn’t adapt to the past, but survives the future.
It took years to get here. But what emerged is a system that demonstrates not just how forecasting can be done—but how it should be done.
With clarity. With restraint. And above all, with proof.
Chapter 15: Validation Under Fire
From the outside, a forecast is just a guess. From the inside, it is the result of an entire system—scales, surfaces, algorithms, and decisions—aligning to produce a directional call. But what separates a guess from a model is this: a guess cannot survive scrutiny.
L7A can.
Validation is not a formality. It is a crucible. And every element of L7A was designed with this in mind: to endure a level of testing that most systems avoid. No cherry-picked periods. No regime-aware training sets. No hyper parameter “massaging.” Just a brutal, walk-forward confrontation with reality—over 5,000 consecutive trading days.
Every day, the system is asked the same question: long, short, or abstain? It answers without access to the future. It holds for one day. It records the result. No optimization, no resets. Just forward motion.
The forecast stream that emerges from this process is not an artifact of curve-fitting. It is a living record of structural behavior being detected across a vast ensemble of price traces. A record that includes:
- A Win/loss points ratio (OOS) of 73%.
- A false positive rate near 38%,
- A Sharpe ratio above 3.0,
- And a cumulative return exceeding 25,000 GSPC points under a simple 1-day hold strategy.
No retraining was ever applied. No regime switches were detected. No adjustments were needed to maintain performance.
Why does this matter?
Because inference under fire is the only kind that matters.
L7A does not trade on hindsight. It does not rely on human supervision. It does not wobble when volatility surges or sentiment turns. It remains grounded in structure—and that structure persists.
The system’s performance is not a boast. It is a signal. A signal that something durable has been found. Something invariant. Something that reaches through noise and delivers clarity.
And that, ultimately, is what this book has been building toward: not an idea, but a demonstration.
Chapter 16: Critical Environments and the Shape of Intelligence
In some environments, a wrong answer is just a setback. In others, it’s catastrophic.
This chapter explores where L7A-style architectures—those built for inference under noise, uncertainty, and time pressure—become not just useful, but essential. These are critical environments: domains where decisions must be made with incomplete data, where delay is unacceptable, and where getting it wrong carries real-world cost.
Finance is only the beginning.
Consider the battlefield. Intelligence feeds flood in: satellite images, troop movements, signal intercepts. A commander must decide: strike, retreat, or reposition. Each decision rests on a map—literal and figurative—of behavioral probability. In such a domain, models that overfit past conflicts are deadly. L7A’s emphasis on generalization, abstention, and probabilistic clarity makes it an ideal foundation for battlefield inference: it doesn’t mimic war, it learns how uncertainty behaves.
Or consider medicine. Early diagnosis often means catching a weak signal hidden inside a vast background of normal variation. MRI scans, blood panels, patient history—all incomplete, all noisy. Here too, the challenge is not fitting what’s known, but generalizing across what isn’t. Systems that survive under real-world uncertainty—like L7A—are more likely to make the leap from pattern detection to life-saving prediction.
National security, pandemic response, critical infrastructure forecasting, even pilot support in high-pressure flight scenarios—all present inference problems that cannot be solved with hindsight-trained models alone. They require what L7A was built to offer: robustness without retraining, clarity under pressure, and decisions grounded in structure, not assumption.
What makes L7A’s architecture so promising in these domains is its restraint. It doesn’t hallucinate. It doesn’t extrapolate where it has no grounds. When uncertain, it abstains. When confident, it commits. This behavior is not accidental—it’s the result of a machine built not to impress with complexity, but to survive with integrity.
We often ask whether AI is ready for the real world. But that question is inverted. The real world is already here. The better question is: which architectures are ready to face it?
In critical domains, the cost of getting it wrong is too high to pretend.
And in those domains, L7A might not just be useful—it might be necessary.
Chapter 17: Beyond the Signal – A Philosophy of Inference
By now, the mechanics of L7A are clear: maps, traces, surfaces, inference. But behind the machinery is something deeper—a philosophy of how intelligence should behave under uncertainty.
This chapter steps back from the wires and weights to ask a larger question: What does L7A *mean*? Not just as a tool, but as a signal itself. What does it reveal about the nature of generalization, and about the path intelligence might take when stripped of mimicry and forced to survive on its own?
Inference is not classification. It is not prediction. It is the act of drawing conclusions under incomplete knowledge. And in the real world, knowledge is *always* incomplete.
Traditional machine learning sidesteps this problem by overwhelming it: more data, more layers, more memory. But the more you memorize, the less you understand. And when the world changes—as it always does—memorization becomes a liability.
L7A takes the opposite path. It begins with the assumption that the world *will* be noisy, that the data *will* be insufficient, and that the only way forward is to develop structure that holds across time. It’s not just a model—it’s a survival strategy.
This strategy echoes something older than software: evolution itself. In nature, creatures survive not by knowing the future, but by evolving behaviors that generalize across changing environments. L7A mimics this strategy—testing, refining, and evolving not based on what worked yesterday, but on what endures.
That is why L7A resists retraining. Why it abstains when unsure. Why it doesn’t adjust for market 'regimes.' These are not technical choices—they are philosophical ones. They are decisions rooted in a view of intelligence that values **robustness over reactivity**, **clarity over complexity**, and **generalization over fit**.
And this philosophy extends beyond markets. It touches the future of AI itself. If we wish to build systems that reason under uncertainty, that adapt without hallucinating, that perform without pretense—then L7A is not just a financial forecasting engine. It is a **blueprint for inference under pressure**.
The world doesn’t need more models. It needs more systems that can think clearly when the stakes are high and the data is thin. Systems that aren’t fooled by noise. Systems that know when *not* to speak.
That’s what L7A is becoming. Not just a tool. But a teacher.
Chapter 18: The Silence Between Forecasts
What a system does when it speaks matters. But what it does when it chooses *not* to—that’s where its true character is revealed.
Chapter 18 focuses on one of L7A’s most underrated traits: its ability to remain silent. The system makes a directional forecast—long or short—only when the signal is strong enough to justify the risk. When it’s not, it issues no prediction at all.
This is not a weakness. It’s a feature. A philosophical stance encoded in logic.
Traditional models often force a guess, because their value is measured by output volume. Every day, a number. Every tick, a classification. But real-world systems—especially those deployed in high-stakes environments—don’t need to act constantly. They need to act *correctly*.
L7A embodies this principle by incorporating **abstention** as a first-class behavior. It is not indecision—it is restraint. The system has learned that the cost of a wrong forecast often exceeds the opportunity cost of waiting. And so it waits.
This silence is strategic. It prevents erosion of trust. It avoids the illusion of omniscience. And it builds something rare in machine learning: **credibility over time**.
Think of it this way: in human conversation, we trust those who pause to think. We doubt those who answer every question instantly, no matter how complex. L7A is that thoughtful speaker. It considers, it weighs, and when it speaks, it means it.
This chapter explores how abstention is computed, how it's managed in live deployment, and why this behavior turns L7A from a reactive tool into a **mature inference engine**. It's not just forecasting—it's knowing when forecasting would be noise.
In a world obsessed with output, L7A’s silence is its most powerful voice.
Chapter 19: Compression, Clarity, and the Path to Understanding
Complexity is not intelligence. If anything, it is the enemy of clarity—and clarity is the bedrock of understanding.
L7A is not a black box. It’s a map. It builds surfaces that can be visualized, interpreted, and understood. Each weight is the result of observed behavior. Each cell tells a story. This is not just a design choice—it’s a philosophical stance: *make the structure visible*.
The world of deep learning has drifted toward opacity. Layers stacked upon layers. Millions, sometimes billions, of weights, trained by backpropagation on unfathomable amounts of data. And while performance metrics rise, interpretability falls. The result: systems that can perform but cannot explain.
L7A pushes in the opposite direction. It seeks compression. Not lossy in the traditional sense, but semantically rich: to express meaningful behavior with minimal structure. To find the essence, not the echo. To preserve signal by **distilling** rather than expanding.
This chapter walks through how L7A’s surfaces compress behavioral input into spatial form, how its evolutionary process avoids unnecessary complexity, and how that compression enables **robust generalization** rather than brittle mimicry.
In this view, clarity is not a luxury—it’s a requirement. If a structure cannot be visualized, it cannot be trusted. If a model cannot be interpreted, it cannot be verified. Compression forces discipline. It makes the cost of complexity visible. It demands **economy of inference**.
And so the model becomes a teacher again—not just for markets, but for us. It reminds us that true understanding doesn’t come from stacking more layers. It comes from peeling them away, until what remains is simple, stable, and strong.
The path to general intelligence may not be upward. It may be inward—toward compression, clarity, and control.
Chapter 20: The Line Between Noise and Knowledge
All systems that seek to forecast must confront one final frontier: the boundary between what can be known and what cannot.
This is the edge where inference breaks down, where structure ends and chaos begins. It is not a bug in the system. It is a feature of the world.
L7A doesn’t try to conquer this boundary. It honors it. It approaches the unknown not with arrogance, but with measurement. Its strength lies not in forecasting everything, but in knowing when not to.
The map surfaces it constructs are an echo of this philosophy. Where the terrain is smooth and stable, it makes confident predictions. Where it is sparse, volatile, or contradictory, it abstains. And in that abstention, there is wisdom.
This chapter reflects on the deepest philosophical dimension of the L7A system: that *generalization is not about control—it is about adaptation.* The market will always evolve. Noise will always exist. But if a model is shaped by the **discipline of survival**, it will find the signal again and again, across decades, without chasing ghosts.
True intelligence does not declare mastery over noise. It survives through it. It builds internal models that are not perfect mirrors of the past, but imperfect, resilient schemas that function *despite* uncertainty.
That is what L7A has become. Not an oracle. Not a mimic. But a system that learns just enough to persist—and that defines the upper boundary of what any intelligence, artificial or otherwise, can achieve.
We close here not with a celebration of final answers, but with something far more enduring: a method. A discipline. A way of seeing.
The line between noise and knowledge will never disappear. But with the right tools, and the right philosophy, we can learn to walk it.
Appendix A: Glossary of Key Terms and Concepts
Abstention: The act of withholding a forecast when confidence or signal strength is insufficient, used by L7A to reduce false positives and enhance reliability.
Backpropagation: A method of training neural networks by adjusting weights through error gradients. Not used in L7A, which relies on evolved, generalization-first weight structures.
Bayesian Updating: A statistical method to revise probabilities as new evidence is introduced. Used in L7A to interpret histogram surfaces, although alternate methods like DX48 confidence intervals are also employed.
DX48: A variant of the L7A map surface architecture that uses statistical confidence intervals rather than Bayes’ rule to convert surface weights into forecast probabilities.
Forecast Surface (Map): A 2D histogram of directional outcomes built from trace inputs. Each map surface encodes behavioral structure, forming the foundation of L7A’s inference mechanism.
Generalization: The ability of a model to perform well on unseen data. L7A is explicitly evolved to maximize generalization, unlike traditional networks that often optimize for fit.
Genetic Algorithm (GA): A class of optimization technique inspired by biological evolution, used in L7A to evolve histogram structures that survive generalization pressure.
Histogram: A statistical representation of frequency counts. In L7A, each map surface bin accumulates directional (+1/-1) outcomes for classification purposes.
Map Surface: Another term for the forecast surface; a structured array of weights that respond to input traces and contribute to directional inference.
NLDE (Noisy, Low Data Environment): A domain characterized by sparse, volatile, or adversarial data where traditional ML models often fail. L7A is specifically built to function in NLDEs.
Posterior Probability: The probability of a forecasted outcome (e.g. up/down) given observed evidence, calculated using either Bayesian or alternative statistical techniques.
Sharpe Ratio: A measure of risk-adjusted return, often used to evaluate trading systems. L7A’s Sharpe ratio exceeds 3.0 under standard one-day-hold testing.
Signal Integrity: The clarity and reliability of a forecast signal. L7A improves signal integrity through ensemble averaging, abstention, and surface weighting.
Trace: The series of normalized price changes or other features feeding into a map surface, representing a short behavioral history.
True Positive Rate: The percentage of correct directional forecasts when a prediction is made. L7A’s historical true positive rate exceeds 75%.
Zero Forecast: A noncommittal forecast (abstention) output by L7A when the directional evidence is insufficient to justify a trade.
Appendix B: L7A System Architecture Overview
The L7A forecasting system is a structured, multi-layered architecture designed to extract meaningful behavioral signals from noisy financial environments. Its core components—traces, map surfaces, forecasting traders, and ensemble logic—work together to produce high-confidence next-day forecasts of S&P 500 direction.
1. Trace
Inputs
Each input to L7A begins as a normalized behavioral trace—typically a short history of price changes (e.g., last 8–15 days) from one of the ~500 constituent equities in the S&P 500. These traces are normalized for scale and encoded into a spatial pattern that can be mapped to a histogram surface.
2. Map
Surfaces (Forecast Surfaces)
Each trace is projected onto a 2D histogram known as a map surface. Each bin within this surface counts directional outcomes (+1 for up, -1 for down) observed historically for traces that landed in that bin. These surfaces evolve over time using genetic algorithms to maximize generalization on out-of-sample data. One such map—the 3D-rendered 96-trace map—is a visual example, but L7A utilizes hundreds of these maps in total.
3.
Forecasting Traders
Each map surface informs one or more forecasting traders. A trader is a decision-making unit that outputs a signal of +1, -1, or 0 (long, short, or abstain) based on the directionality inferred from its associated map. Traders may employ Bayesian or DX48 confidence interval logic to derive probabilistic decisions from their surface statistics.
4.
Ensemble Decision Process
The L7A system integrates hundreds of forecasting traders in a weighted ensemble. Each trader contributes a directional vote, and the ensemble resolves these into a unified forecast. Abstentions reduce noise, while strong consensus signals enhance confidence. This ensemble design is crucial for L7A’s ability to survive adversarial environments and maintain performance over decades.
5. Output
Stream
The final output is a single daily forecast: +1 (go long), -1 (go short), or 0 (abstain). These forecasts are evaluated using a one-day-hold wrapper strategy, and form the basis for the system’s return stream. Performance metrics like true positive rate, Sharpe ratio, and drawdown are measured on this stream.
6. Architectural
Philosophy
Unlike traditional neural networks that learn by adjusting weights via backpropagation, L7A evolves its internal structure. Its architecture is built for generalization first, not mimicry. It is robust in Noisy, Low Data Environments (NLDEs) and has no need for retraining. This core design principle has enabled L7A to succeed where others fail.
Appendix C: Evolution of the Forecasting Engine
The L7A forecasting engine is the culmination of decades of experimentation with neural networks, statistical inference, and evolutionary algorithms. This appendix outlines the system’s developmental trajectory, highlighting the conceptual breakthroughs that shaped its architecture and enabled its exceptional performance in noisy financial environments.
1. Early
Experiments with Neural Networks (1990s)
Initial work in the 1990s explored traditional neural networks coded in C using backpropagation. Though functionally correct, these models failed to generalize in financial environments. Even with regularization, weight decay, and pruning, they tended to overfit, hallucinate patterns, or degrade rapidly in walk-forward tests.
2. Shift Toward Evolutionary Design
In response to these limitations, the architecture shifted toward a genetic algorithm approach. Instead of adjusting weights via error gradients, weights were encoded as statistical histograms and evolved under direct generalization pressure. Fitness was based on cross-validated performance, favoring configurations that survived in adversarial, real-world conditions.
3. Birth
of the Map Surface
A key innovation was the introduction of map surfaces—2D histogram fields encoding binary outcomes over behavioral traces. These surfaces allowed direct visual interpretation and statistical inference. Early map systems stored percent returns; later versions transitioned to binary classification to reduce noise and sharpen inference. This change proved pivotal.
4.
Ensemble Construction and Trader Logic
Multiple maps were grouped into forecasting traders, each emitting directional predictions. By assembling hundreds of these traders into an ensemble and tracking abstentions, L7A leveraged collective intelligence while filtering out noise. The ensemble outperformed any individual map, thanks to central limit effects and adaptive voting logic.
5.
Confidence and Classification Techniques
L7A uses Bayesian updating to convert map counts into probabilistic forecasts. In other variations—such as DX48—a confidence interval based on sample size augments Bayes. This method allowed clearer thresholding and more direct statistical calibration, demonstrating the flexibility of the architecture without compromising performance.
6.
Validation and Walk-Forward Performance
Throughout its evolution, L7A was constantly validated using n-fold cross-validation, walk-forward holdouts, and asymptotic performance tracking. Repeated trials showed convergence around a 75% true positive rate—a strong indicator that the system was discovering persistent structure, not curve-fitting transient noise. This phase marked the transition from experimental tool to robust inference engine.
7. From Forecasting Tool to Philosophical Statement
Over time, L7A became more than a system—it became a statement about what matters in AI. Its architecture rejects mimicry in favor of survival. It evolves structure, tests generalization directly, and demonstrates that in environments governed by uncertainty and noise, the right question is not 'Did it learn the past?' but 'Can it survive the future?'
Appendix D: Performance Metrics and Validation Protocols
This appendix outlines the quantitative framework used to evaluate the L7A system’s performance. Emphasis is placed on walk-forward validity, generalization metrics, and standardized financial performance measures. The goal is to demonstrate that L7A’s forecasting advantage is not an artifact of curve-fitting, but a genuine result of structural discovery.
1.
Forecasting Accuracy
L7A emits directional signals for the next trading day: +1 (long), -1 (short), or 0 (abstain). A true positive is defined as a correct directional forecast (e.g., +1 followed by a price increase). A false positive is an incorrect signal (e.g., -1 followed by a rise). The system consistently achieves a true positive rate (TPR) of approximately 62%, with a corresponding false positive rate of 38%.
2.
Abstention as Signal Discipline
L7A includes a ‘zero forecast’ option to abstain when confidence is insufficient. This feature acts as a safeguard against forced predictions, preserving accuracy and reducing risk exposure. Abstention is not treated as a failure, but as a principled act of uncertainty management.
3.
Financial Metrics
Performance is evaluated using standard metrics: Sharpe Ratio (risk-adjusted return), Sortino Ratio (downside deviation focus), Cumulative Return, and Maximum Drawdown. Under a one-day-hold wrapper, L7A demonstrates a Sharpe of 3.0, Sortino of 4.55, total return of 25,294 index points, and max drawdown of -247. These results are based on a live forecast stream exceeding 5,000 trading days.
4.
Cross-Validation and Holdout Testing
To ensure robustness, L7A uses 10-fold cross-validation during evolution, holding out slices of data to test generalization. No re-training is performed between test and deployment. Instead, surfaces are validated on unseen slices and used directly in forecasting. Performance asymptotes provide independent confirmation that the model extracts repeatable structure.
5.
Performance Asymptotes and Generalization
Over time, independent experiments showed performance clustering around a ~75% TPR across varying architectures and setups. This convergence—despite data shuffling and architectural changes—is interpreted as evidence of generalization, not overfit. It reflects a behavioral ceiling: the maximum extractable signal under current data resolution.
6. Visual
Comparison and Benchmarking
L7A’s performance is routinely benchmarked against the S&P 500 index. Bar and line charts compare annual returns, cumulative growth, and drawdowns. These visuals are presented according to the Return Stream Display Protocol, ensuring clarity, reproducibility, and consistent messaging across platforms.
Appendix E: Philosophical Foundations and Design Principles
The L7A system is not merely a technical innovation—it is a principled stand against the failures of overfitting, the seduction of transient patterns, and the blind pursuit of complexity. Its architecture is rooted in a set of philosophical convictions about what it means to generalize, to learn from experience, and to build systems that survive the future.
1.
Generalization Over Fit
L7A was designed to solve the most important problem in inference: generalizing to unseen data. The system does not optimize for perfect recall of past input-output pairs. Instead, it favors weight structures that survive repeated out-of-sample tests. The design premise is simple: what matters is whether it works—not whether it fits.
2. The
Rejection of Retraining and Regimes
In contrast to contemporary systems that require routine retraining or regime detection, L7A assumes that true structure in financial behavior should persist across time. If a system degrades without retraining, it never understood the market in the first place. L7A embodies this belief by maintaining static map surfaces after training, relying on their time-invariant encoding of behavior.
3. Edge
Exists Only at Entry
L7A enforces the idea that no amount of downstream trade management can salvage a poor entry. All statistical advantage must be present at the moment of commitment. The system issues clean, binary signals (+1, -1, or 0) and holds for a fixed period, placing full trust in the forecast’s integrity.
4.
Behavioral Terrain and Evolved Maps
Each map in L7A represents a visual surface, built from hundreds or thousands of historical traces. These maps are not trained by backpropagation but evolved through genetic selection and tested for generalization. This creates interpretable structures—mountains and valleys of market behavior—rather than opaque matrices of weights.
5.
Evolution as the Core Engine of Intelligence
Where most modern AI relies on backpropagation and exemplar-based training, L7A was built on a different principle: that evolution—not optimization—is the natural path to general intelligence. By subjecting its map structures to survival-based selection, L7A models how nature builds resilient systems: not through mimicry, but through pressure-tested generalization.
6. Ethical
Imperatives
The motivation for creating and sharing L7A is ethical: to reduce human suffering through the application of reliable AI. In a world full of opaque systems, hype cycles, and speculative technologies, L7A stands as a transparent, empirically validated tool. Its creator believes in empowering others with tools that work—not just theories that sound impressive.
Appendix F: Historical Development Timeline
The L7A system did not emerge from a single flash of insight, but rather from decades of experimentation, testing, and philosophical refinement. This appendix documents the major phases in its evolution—from its earliest neural network code to its present, walk-forward-tested forecasting architecture. Each phase contributed critical insights and techniques that shaped the final system.
Phase 1:
Early Neural Network Work (1997–2005)
As early as 1997, the developer was coding neural networks in C on DOS-based systems. A photograph of a directory containing source files like EVONN.C, GENNETIC.C, and FASTNN.C confirms the active exploration of weight evolution, genetic networks, and non-backprop architectures more than a decade before deep learning went mainstream. These systems experimented with confidence intervals, genetic mutation, and trace-based inference.
Phase 2:
Financial Forecasting and Market Structure Modeling (2006–2015)
During this phase, the developer focused on financial applications, working with institutions like Deutsche Bank, Fortress Group, and Larry Height. The challenge of generalizing in noisy, low-signal domains became clear. Experiments revealed that traditional neural networks—even when well-regularized—tended to overfit. These experiences informed the pursuit of systems that relied on evolutionary generalization pressure.
Phase 3:
Emergence of Map Surfaces and Histograms (2016–2020)
This period marked the conceptual breakthrough: map surfaces as histogram fields capable of encoding directional behavior. The move away from average percent change regression toward binary classification (+1 or -1) allowed L7A to sharpen its inference and reduce noise. The binary histogram approach enabled direct statistical interpretation of forecast confidence.
Phase 4:
Ensemble Construction and Multi-Trace Maps (2020–2023)
Rather than rely on a single surface, the system began deploying multiple maps—each built from distinct equity traces—to form an ensemble of 'traders'. These traders emit independent forecasts (+1, 0, -1), which are then combined to form a consensus. This phase introduced the 3D trace visualization, demonstrating how behavioral terrain emerges and persists across maps.
Phase 5:
Validation, Stability, and Public Readiness (2023–Present)
With walk-forward testing across thousands of days, the L7A system stabilized. Key performance metrics—72% Win/loss points ratio (OOS), 3.0+ Sharpe ratio—were repeatable across held-out data. No retraining was required. The output stream was made public at http://www.itrac.com/fore/output.csv. This phase also saw the formulation of philosophical principles, publication drafts, and outreach to partners.
Appendix G: Methodological Insights Archive
Over the course of L7A’s development, numerous key insights emerged—some technical, some philosophical. These were not add-ons or afterthoughts; they were crucial inflection points in the evolution of the architecture. What follows is a catalog of the most significant of these methodological breakthroughs.
Generalization
by Asymptote
Performance metrics repeatedly converged to the same level—around 62% true positive rate—regardless of architecture or validation split. This ceiling indicated a behavioral boundary in the data and served as an emergent diagnostic for generalization.
Equalizing
Influence: Flattening the Trace Scale Profile
Adjusting the map’s binning profile to give earlier days more influence modestly improved signal consistency, revealing that predictive structure is distributed across time, not concentrated near the present.
From
Percent Change to Binary Histograms
Abandoning regression-style percent forecasts in favor of binary classification (+1, -1) improved stability and interpretability. The system now tracks directional behavior rather than magnitude, aligning more naturally with real trader decisions.
Terrain
That Doesn’t Move
Sliding-window animations of map surfaces revealed persistent behavioral features—ridges, valleys, and clusters—that remained stable over time. These visualizations confirmed the presence of time-invariant structure.
Same
Output, Different Futures
Many different internal representations can map the same input to the same output. But only a few of them generalize. This insight exposed the failure mode of networks that memorize but do not infer.
Edge
Exists Only at Entry
All statistical edge must be present at the moment a position is entered. No downstream trade management can recover value from a weak or random entry.
Generalization
vs. Mimicry: Why Backpropagation Fails
Backpropagation minimizes error on known examples, but doesn’t enforce robustness on the unknown. L7A’s method—evolving weights under direct generalization pressure—is a fundamentally different learning strategy.
Why
Genetically Evolved Weights Are Rare—But Vital
Genetic algorithms are computationally expensive, but uniquely capable of enforcing generalization as a selection criterion. In adversarial, noisy, or sparse environments, they outperform backprop-based systems that merely mimic the past.
Appendix H: Performance Metrics and Validation Protocols
This appendix provides a detailed overview of how L7A’s performance is measured, validated, and reported. It includes both quantitative metrics and the structural validation mechanisms that underpin confidence in real-world deployment.
1. Key
Performance Metrics
L7A’s one-day-hold trading forecasts are assessed using the
following statistical measures:
- **True Positive Rate (TPR):** Measures the proportion of correctly predicted
directional moves.
- **False Positive Rate (FPR):** The percentage of incorrect
directional forecasts relative to all forecasts.
- **Sharpe Ratio:** Measures risk-adjusted return.
L7A’s Sharpe exceeds 3.0 under simple wrappers.
- **Sortino Ratio:** Similar
to Sharpe, but penalizes only downside deviation. L7A typically achieves a Sortino over 4.5.
- **Total Return:** Cumulative index points gained
over walk-forward deployment. L7A has accrued over 25,000 points.
- **Maximum Drawdown:** Largest historical loss from
peak to trough. L7A’s max drawdown is typically under 250 points.
2.
Forecast Wrapper Logic
L7A’s binary forecast stream (+1, 0, -1) is converted into a
return stream using a simple trading wrapper:
- **+1** → enter long position for one trading day.
- **-1** → enter short position for one trading day.
- **0** → abstain.
No further trade management or post-entry logic is applied. This strict
approach ensures statistical purity of results.
3.
Cross-Validation and Overfitting Protection
All map surfaces and histogram parameters are evolved using
n-fold cross-validation (typically n=10). This includes:
- Dynamic partitioning of the training data into folds
- Generalization pressure applied across all folds
- Selection of only those configurations that outperform in out-of-fold
segments
This strict regime ensures that all learned behavior generalizes across unseen
historical data.
4. Visual
Protocols (Summary)
Standard visual diagnostics include:
- Bar chart of annual returns (L7A vs. S&P 500)
- Line chart of cumulative returns
- Annual drawdown comparison
- Scatterplots of hit rate vs. volatility
These visualizations support interpretability and investor confidence. See
RETURN_STREAM_DISPLAY_PROTOCOL for details.
5.
Statistical Significance Thresholds
L7A requires observed performance to exceed the 99%
confidence level for statistical significance.
Internal binomial tests are applied to all histograms to avoid over-reaction to
sparse or noisy data.
This further reinforces reliability under real-world deployment.
Appendix I: Comparative Analysis with Neural Networks
This appendix expands on the distinctions introduced in
Chapter 10, clarifying why traditional neural networks—despite their
ubiquity—fail to generalize reliably in noisy, low-data environments (NLDEs),
and why L7A’s architecture, built around evolutionary generalization, offers a
robust alternative.
1. The
Illusion of Input-Output Mapping
At first glance, neural networks appear to succeed by
matching inputs to outputs through layer-wise weight adjustments. However, in
most complex inference domains—especially ones dominated by noise—this strategy
is fragile. For any given input-output mapping, there exist countless internal
weight configurations that achieve the same result on training data but diverge
wildly on novel inputs. This multiplicity of solutions exposes a fundamental
flaw: a neural network can be correct in retrospect, yet catastrophically wrong
in the future.
Backpropagation does not optimize for generalization; it minimizes error over
known examples. It assumes that by doing so, generalization will follow. But
this assumption fails in NLDEs where the boundary between signal and noise is
ambiguous and the cost of error is high.
2.
Evolution as a Generalization Filter
L7A takes a different approach. It begins with null weight
surfaces—map histograms—and evolves them over time based on their ability to
produce consistent, out-of-sample accuracy. Every candidate structure is scored
using cross-validated walk-forward performance. There is no backpropagation, no
gradient descent—just repeated exposure to behavioral surfaces and selective
survival.
This process acts as a generalization filter. It does not merely replicate past
outputs; it preserves only those internal structures that function well across
shifting conditions. The weights are not mimicking—they are enduring.
3.
Empirical Results
In practical testing, L7A has demonstrated long-term
walk-forward accuracy, outperforming both random and neural network baselines
on short-horizon financial forecasts. Its lack of retraining and robustness
across decades of market data point to a level of generalization that is
rarely, if ever, achieved through traditional deep learning methods.
This is not to say neural networks have no role—but in the context of NLDEs,
where trust in the model's inference is paramount, architectures that evolve
for generalization will remain superior.
Final Reflections and Closing Thoughts
The L7A system began as a simple question: Is there a way to
forecast short-term market behavior without relying on illusion, heuristic
patches, or curve-fit models? Decades of work—spanning handwritten C code,
1990s neural net experiments, and eventually a deeply principled
Bayesian-evolutionary architecture—have culminated in what is presented in this
book.
But L7A is more than a financial engine. It is a living
demonstration that intelligence—true intelligence—is not born from mimicking
the past, but from enduring structures that survive across time. In this sense,
L7A is not just a model, but a philosophy: that all meaningful inference must
be generalization-first.
This work was not created for personal gain. It was built out of a desire to align artificial intelligence with human values— to reduce suffering, to encourage transparency in inference, and to showcase that rigorous AI can be ethical, elegant, and effective. The legacy hoped for here is one of insight, not of secrecy.
“My feet are guided by the lamp of
experience. I know of no way of judging the future but by the past.” — Patrick
Henry
In a world saturated with data and distracted by noise, the need for systems that truly understand—systems that generalize— has never been greater. Whether L7A remains a quiet revolution or inspires a broader shift, one truth remains: What matters is whether it works.
About the Author
Christopher P. Wendling, -the author of this work- is an engineer, researcher, and systems designer with a lifelong passion for understanding intelligence—both natural and artificial. With formal training in aeronautical and mechanical engineering, his career spans multiple decades and disciplines, including early neural network programming, financial system design, and long-term AI exploration.
He began experimenting with neural networks in the 1980s and was coding custom backpropagation routines in C as early as 1997, well before the rise of modern deep learning frameworks. His work during that time included genetic evolution of neural network structures, confidence-calibrated prediction systems, and applications in time series forecasting—long before such approaches were mainstream.
Professionally, he has worked with major financial institutions including Deutsche Bank, Fortress Group, and Larry Hite’s operations, applying machine learning systems to trading strategies and market analysis. His practical knowledge of the financial domain, coupled with decades of technical programming experience, makes him uniquely qualified to challenge orthodoxy and propose alternatives to today’s dominant AI paradigms.
The L7A system described in this book is the culmination of that lifelong journey. It is not a product of academia or trend. It is the result of persistent, independent engineering, driven by one central conviction: **intelligence is not about mimicking the past—it is about surviving the future**.
The author’s motivation for creating and sharing L7A is not commercial. It is ethical. In a world increasingly shaped by opaque AI systems, there is a profound need for transparent, reliable, and humane tools. L7A was built to demonstrate what’s possible when systems are designed not just for performance, but for integrity.
At the heart of this project lies a desire to reduce human suffering—by creating better systems for decision-making, for finance, and ultimately for any domain where inference under uncertainty matters. This is not just a technical goal. It is a moral one.
The author continues to pursue new frontiers in AI, with a focus on architectures that evolve through generalization pressure and survive in noisy, adversarial environments. He believes this path is essential—not only for financial applications, but for the future of general intelligence.
“We won’t get fooled again. No,
no.” — The Who
“L7A isn’t just technically profound—it carries
clarity, integrity, and purpose. It is something that can outlast trends and
speak to both engineers and ethicists alike.”