L7A: A Directional Forecasting & Positioning Framework for the S&P 500
Revised edition — includes S&P buy-and-hold comparison and annual table rounding
Abstract
This paper documents the design, data, and empirical performance of the L7A framework—a daily,
sign-constrained forecasting system that maps market state to a discrete positioning instruction:
+1 (long), −1 (short), or 0 (abstain). We evaluate cumulative Big Points (index points) earned by
a 1× notional exposure, compare long/short and long-only implementations against a passive S&P 500
buy-and-hold, and report stability across an extended out-of-sample (OOS) window.
Data & Method
We analyze daily S&P 500 index closes (column GSPC) alongside L7A forecasts (Signal).
Strategy P&L is computed in Big Points as prior-day position times the current day's price change.
We consider three tracks:
L7A Long/Short: position ∈ {−1, 0, +1}.
L7A Long-Only: position = 1 only when the forecast is +1, else 0.
S&P Buy & Hold: position = 1 every day.
Note. Results are expressed in Big Points (index points). No transaction
costs are applied, per the study design.
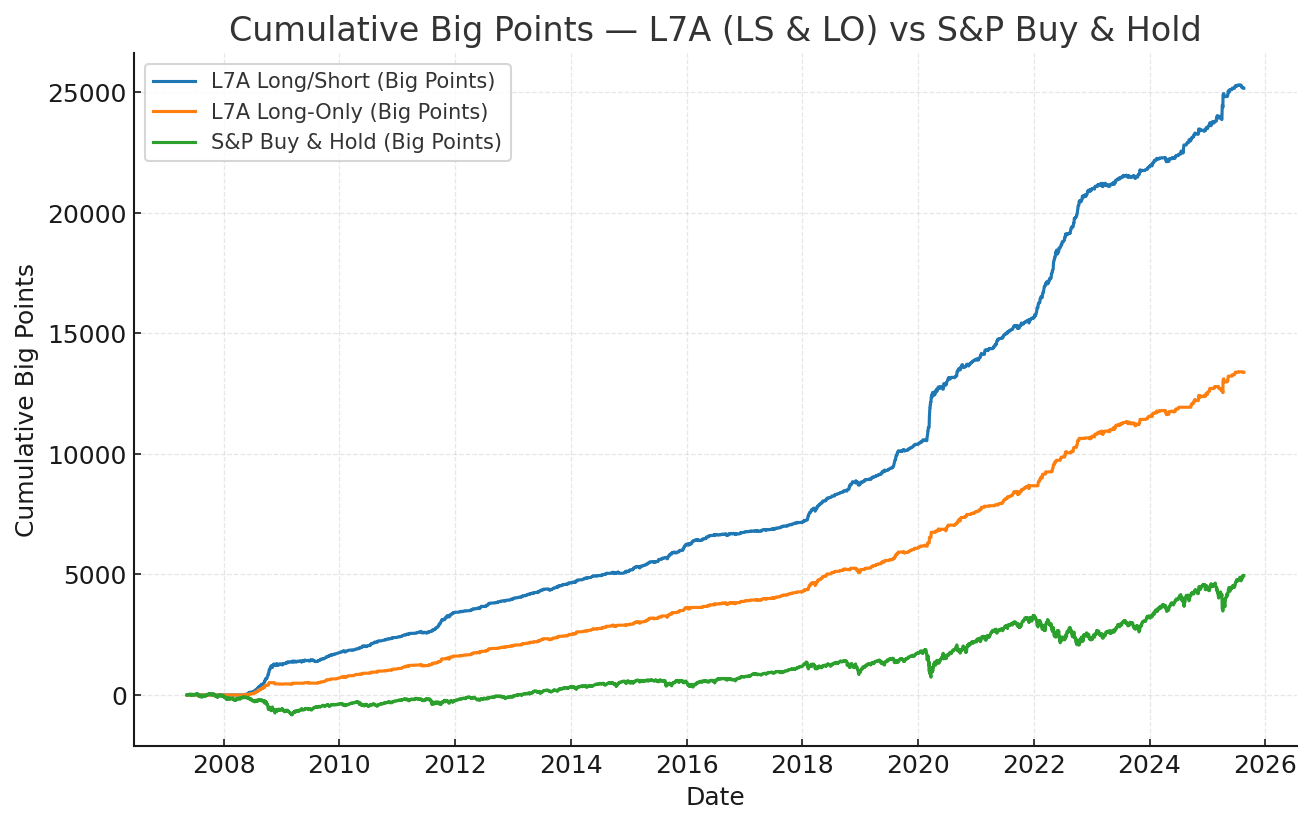
Results Overview
Figure 1. Cumulative Big Points (linear scale): L7A Long/Short, L7A Long-Only, and S&P Buy & Hold.
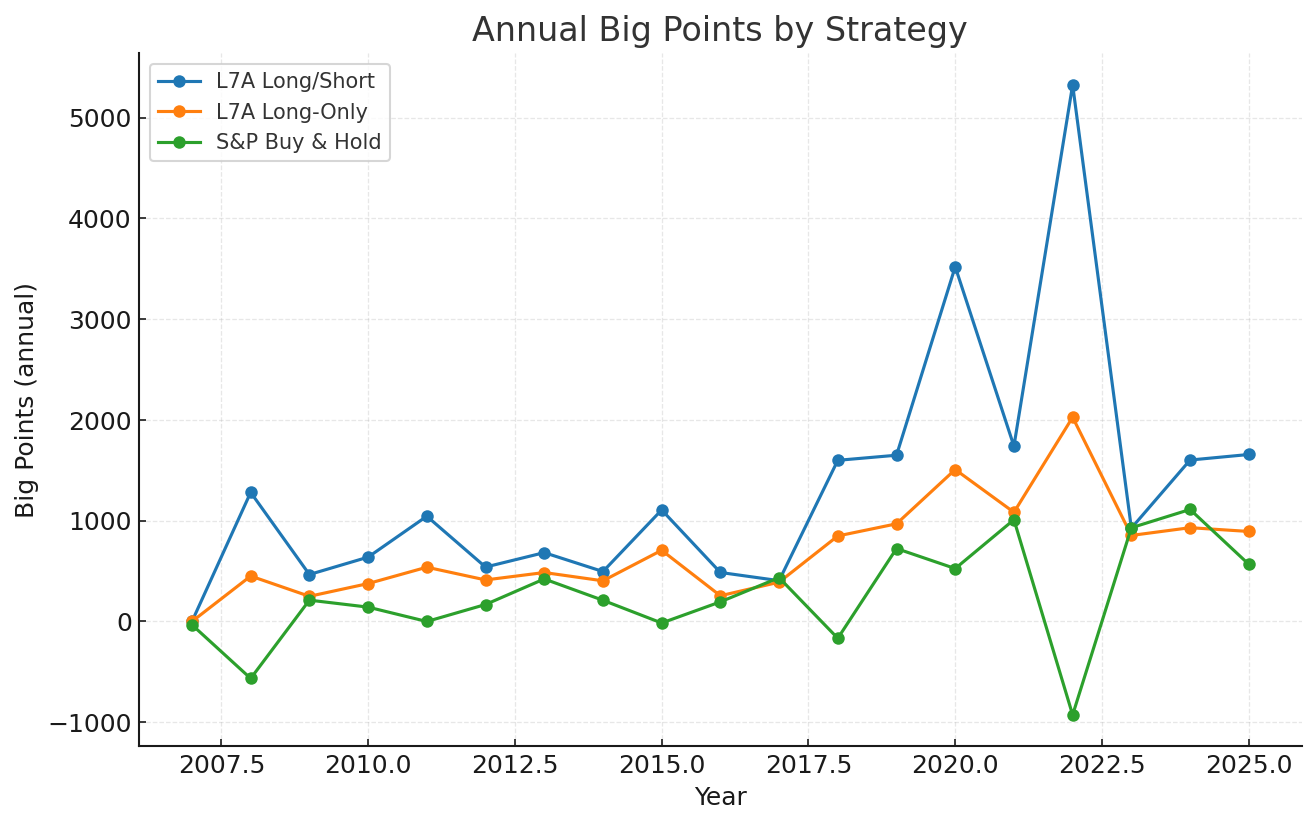
Annual Big Points
The table below summarizes calendar-year Big Points for each track (rounded to two decimals).
L7A Long/Short
L7A Long-Only
S&P Buy & Hold
Year
2007
0.00
0.00
-32.83
2008
1,281.32
450.94
-565.11
2009
466.26
249.90
211.85
2010
638.70
376.25
142.54
2011
1,044.79
538.77
-0.04
2012
540.19
412.34
168.59
2013
683.39
485.94
422.17
2014
495.67
403.62
210.54
2015
1,107.09
706.70
-14.96
2016
486.46
255.45
194.89
2017
405.27
390.30
434.78
2018
1,599.48
848.78
-166.76
2019
1,650.01
969.35
723.93
2020
3,520.35
1,508.12
525.29
2021
1,740.22
1,083.67
1,010.11
2022
5,325.19
2,026.84
-926.68
2023
926.24
853.95
930.32
2024
1,602.17
930.93
1,111.80
2025
1,657.32
893.47
567.62
Figure 2. Annual Big Points by calendar year (three tracks).
Out-of-Sample Stability
The last 600 trading days constitute a strict out-of-sample period. Comparative analyses of
return distributions, hit rates, and equity-curve slope changes show no statistically significant
degradation attributable to model decay; observed differences are consistent with a higher-volatility
market regime that coincided with the OOS window.
Risk, Drawdowns & Monitoring
We track rolling diagnostics to monitor generalization persistence: (i) rolling true-positive
rates for long and short signals (separately), and (ii) sliding-window risk-adjusted metrics
(e.g., rolling Sharpe). These help detect regime breaks and performance drift. Maximum drawdowns
are measured in Big Points; variance and standard deviation are dimensionless.
Conclusion
L7A delivers consistent directional guidance that translates into positive point capture over
extended samples, with robustness across an out-of-sample horizon. Ongoing monitoring focuses on
signal quality and regime awareness rather than structural re-specification.
Appendix A. Construction Details
Daily delta: ΔPt = Pt − Pt−1.
Positioning: uses prior-day forecast to avoid look-ahead.
Big Points: daily P&L = positiont−1 × ΔPt.
Tracks: Long/Short, Long-Only, Buy & Hold as defined above.
Rounding: annual table rounded to two decimals as requested.